What source can tell you about performance
HTML source cannot measure every performance metric, but it can reveal what a page asks the browser to load. Stylesheets, scripts, images, fonts and third-party resources are often referenced directly in markup. Reviewing these references provides useful clues before you run a detailed performance test.
Continue exploring: Use the ViewSourcePage source analyzer to inspect a public page, then compare your findings with our guide on How to View Page Source on Any Device: Desktop, Android & iPhone.
Render-blocking CSS
Stylesheets referenced in the head can delay rendering because the browser may need to process them before painting the page. Source inspection can show how many stylesheets are requested and whether they appear to be large framework bundles or page-specific files. Actual impact should be measured with browser performance tools.
JavaScript dependencies
Script tags can reveal analytics, chat, advertising, widgets and application bundles. A page with many third-party scripts may have more work to perform during loading. Source inspection helps create an inventory, while network waterfalls show when those files load and how much time they consume.
Image references
Image elements and source sets can reveal whether pages use responsive images, appropriate formats and descriptive attributes. Look for width and height attributes where appropriate and examine whether large original images are being delivered to small mobile displays. Source provides clues, not a complete byte-level performance measurement.
Fonts and external resources
Web fonts, embedded resources and external hosts can affect connection setup and rendering. Source inspection may reveal preconnect or preload hints, stylesheet URLs and font references. These hints need careful use; adding preload tags indiscriminately can make performance worse rather than better.
Third-party scripts
External scripts can introduce latency, privacy considerations and additional CPU work. Build a list of external domains from script, link and image references. Then decide which resources are essential, which can be deferred, and which should be removed.
HTML size and duplication
A very large HTML document can increase transfer and parsing work. Source inspection makes obvious duplication visible, such as repeated markup blocks, enormous inline data or serialized application state. A source viewer can show the structure, while a network panel is better for exact transfer sizes and compression.
Preload, preconnect and lazy loading
Source can reveal performance-related attributes and resource hints. Check whether images below the fold use lazy loading where appropriate and whether critical resources are prioritized sensibly. Do not add optimization attributes simply because they sound fast; each hint should correspond to a real loading strategy.
From source clue to measurement
After finding a potential issue, validate it with real metrics such as Largest Contentful Paint, Interaction to Next Paint, Cumulative Layout Shift, transfer sizes and request timing. Source inspection is the hypothesis stage; performance measurement is the verification stage.
Conclusion
A page source review is a fast way to understand the resource architecture behind a webpage. It can uncover obvious script, stylesheet, image and markup patterns that deserve attention. Pair those observations with field and lab performance data to make decisions based on measured impact rather than assumptions.
A practical checklist
Use this checklist when reviewing a real page so the process stays repeatable rather than relying on memory.
- Inventory scripts
- Review stylesheets
- Inspect image markup
- List third-party hosts
- Measure suspected bottlenecks
Frequently asked questions
Does source inspection show private backend code?
No. A browser receives only the public response needed to render or process the page. Private application logic, databases, server credentials and protected files remain on the server.
Is a source viewer a replacement for a full audit?
No. It is a focused inspection layer. Use dedicated SEO, accessibility, performance, security and analytics tools when you need deeper evidence.
Final thoughts
Source inspection is valuable because it turns an invisible technical layer into something you can read and reason about. The best workflow is simple: observe the public markup, identify a specific question, verify the relevant element, and then use a specialist tool when the question goes beyond HTML. This keeps technical analysis practical, evidence-based and easy to repeat across pages.
Deeper practical notes
Performance work should begin with measurement, but source inspection is excellent for forming hypotheses. If a page contains twelve third-party scripts, several large stylesheet references and unoptimized image markup, you have obvious candidates for investigation. The next step is to measure their real cost rather than assuming every reference is a bottleneck.
Script placement matters. A synchronous script in the head can affect parsing and rendering differently from a deferred or asynchronous script. Source inspection can reveal the attributes used on script tags. Network and performance tools are then needed to determine actual execution time and blocking behavior.
Images are often a major part of page weight. Look for srcset and sizes, width and height attributes, lazy-loading behavior and image formats. A source viewer can show whether responsive markup exists, but it cannot tell you the final compressed byte size of every resource under every device condition.
CSS architecture can also affect performance. Many page-specific stylesheets, framework bundles and unused rules may increase transfer or parsing work. Source can identify the number and location of stylesheets. Coverage and performance tools can then show which rules are actually used.
Third-party resources deserve a risk-and-value review. Analytics, chat, advertising and embedded media can provide business value, but each dependency adds requests or processing. List the external hosts, decide which are essential, and measure their effect on real pages before making changes.
Caching and compression cannot be diagnosed from HTML alone. A source document may look lean while the server sends it slowly. For that reason, combine source inspection with HTTP response headers, transfer sizes, TTFB and field data. The source tells you what the page contains; performance measurement tells you how quickly users receive and process it.
Applying the guide in a real audit
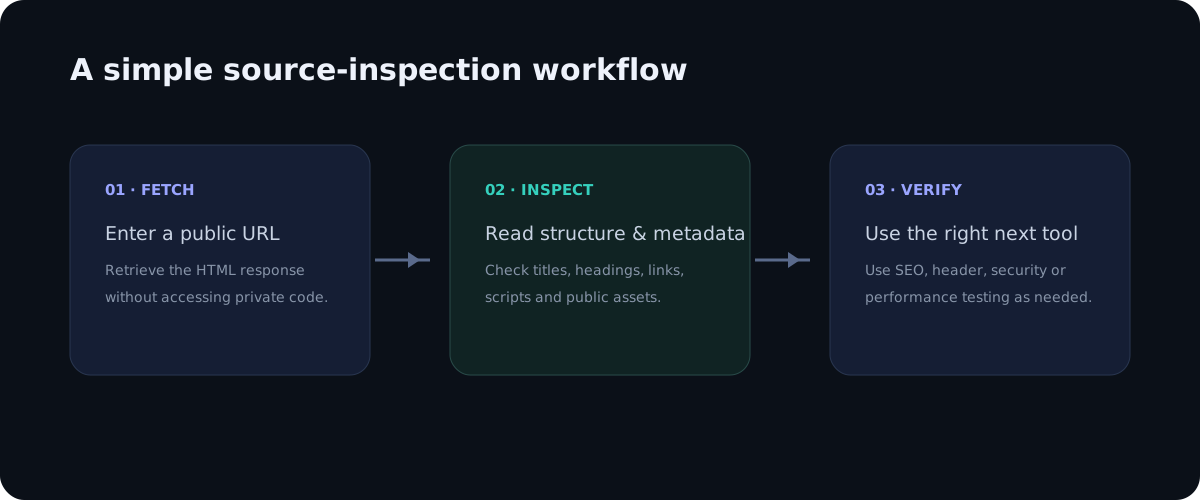
When applying this workflow to website performance: what you can spot in page source, begin with one concrete question rather than trying to audit everything at once. A focused question makes source inspection faster and produces evidence that can be shared with a developer, editor or SEO specialist. Record the page URL, the element you inspected and the observation you made. This simple habit turns an informal browser check into a repeatable technical review.
It is also useful to compare more than one page template. A homepage, article, category page and utility page can have different HTML structures even when they share the same brand. Looking at several examples helps distinguish a one-off issue from a template-level problem. If the same markup appears across many pages, the best fix is usually at the template or component level rather than by editing individual pages.
Keep the difference between evidence and interpretation clear. Seeing an element in source is evidence that the public response contains that element. It is not automatically evidence that a search engine indexed it, that a browser loaded every referenced asset, or that a backend process is secure. Strong technical analysis connects source observations with the right secondary test instead of making conclusions that the HTML alone cannot support.
Another practical benefit is documentation. A source viewer with readable line numbers makes it easier to describe an issue precisely: for example, a missing canonical, an unexpected robots directive, a duplicate heading, or a third-party script reference. Clear documentation shortens the feedback loop between SEO teams, developers and content owners because everyone can discuss the same technical evidence.
Finally, treat the public source as part of the user experience. The document should be understandable, semantically organized and consistent with the visible interface. Good HTML structure supports accessibility, maintainability and search understanding at the same time. A clean source document is not a guarantee of quality, but it is a strong foundation for a website that is easier to maintain and easier for people and machines to interpret.